.png)
Global equities continued to advance during the third quarter, but market leadership has begun to shift. After underperforming Canadian equities earlier in the year, U.S. equities began to regain ground: the S&P 500 returned 2.3% during the quarter, ahead of the S&P/TSX Composite at 1.6%. Canada nevertheless retained a slight year-to-date advantage, returning 13.0% compared with 12.7% for the S&P 500.
Bonds remained the principal pain point. Canadian bonds declined 3.0% during the quarter and remained negative year to date as persistent inflation, expectations of renewed policy tightening and rising government yields challenged the traditional assumption that bonds will reliably stabilize portfolios. In this new regime, fixed income remains capable of generating income, but duration is no longer an uncomplicated source of diversification.
Emerging markets remained the year’s strongest major equity category, returning 23.5% year to date even after slipping 0.4% during the quarter. However, today’s emerging-markets exposure is increasingly a concentrated bet on the global AI buildout. Information technology now represents approximately 41.5% of the MSCI Emerging Markets Index, while TSMC, Samsung Electronics and SK Hynix collectively account for nearly 28% of the benchmark. Taiwan, South Korea and China together represent almost 69% of the index. This composition has helped emerging markets participate directly in surging demand for advanced semiconductors, high-bandwidth memory and AI infrastructure. It also creates a significant concentration vulnerability: investors seeking diversification away from U.S. technology may instead be adding exposure to a different part of the same AI trade.
Markets enter the fourth quarter with positive equity momentum but weakening participation. Fewer than 45% of S&P 500 stocks remain above their 200-day moving averages, down from roughly 75% in mid-August, leaving the index increasingly dependent on large technology companies. Against this backdrop, here are the key developments we are watching as we head into the final quarter of the year.
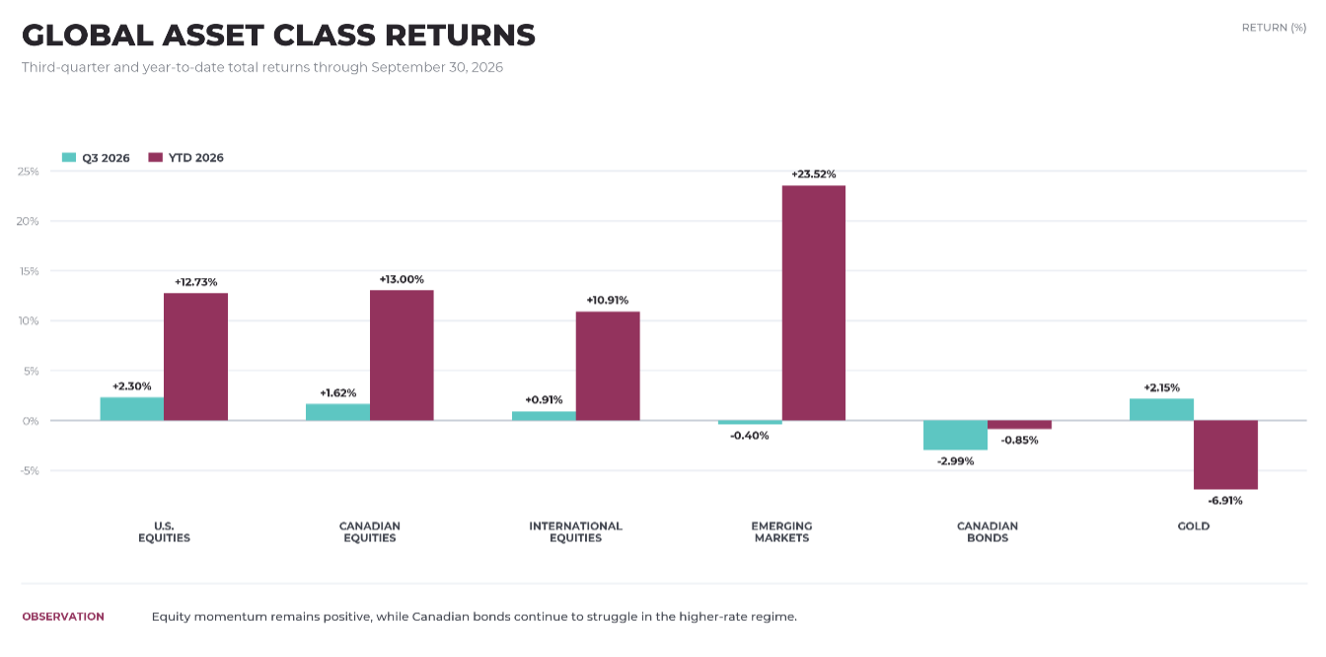
Sources: Bloomberg and QW Asset Management. Total returns through September 30, 2026. Index proxies: S&P 500, S&P/TSX Composite, MSCI EAFE, MSCI Emerging Markets, XBB and gold futures.
Treasuries Above 5%: A Higher Hurdle Rate for Everything
The 10-year Treasury yield has climbed to approximately 5.3%, its highest level since 2002. The move reflects several forces converging at once: resilient economic growth, persistent inflation, rising government debt and an increasingly crowded market for long-duration capital.
The AI investment boom is part of that story. Data centres, semiconductor capacity and power infrastructure require enormous upfront investment, some of which is being financed through corporate bond issuance. These securities compete with Treasuries for investor allocations, increasing the overall supply of bonds and requiring higher yields to attract sufficient demand. The effect is especially relevant for highly rated technology issuers whose bonds can serve as close substitutes for government debt.
Inflation risk has also returned. The U.S.–Iran conflict has pushed energy prices higher, raising concerns that inflation will remain above target for longer. Investors are consequently demanding greater term premium as compensation for holding long-term nominal bonds whose purchasing power could be eroded by persistent inflation.
Concerns over rising debt and Treasury supply have further complicated the outlook. In mid-August, Treasury Secretary Scott Bessent responded by doubling planned buybacks of 10- to 30-year securities from $2 billion to at least $4 billion per operation, effective September 9 through November 4, and signalled that individual operations could be larger. The program was intended to improve liquidity and support the long end of the market. Yields fell briefly on the announcement but erased those declines within a day and continued to climb, suggesting the intervention may have highlighted—rather than resolved—concerns about fiscal sustainability and market demand.
The result is a potentially reflexive cycle: AI-related borrowing and government issuance place upward pressure on yields, while higher yields raise the hurdle rate for the investments driving economic and equity-market growth. Treasury buybacks may improve market liquidity, but they cannot sustainably suppress yields without improvement in inflation, fiscal deficits and underlying debt supply.
Key takeaway: For the economy to digest higher yields, nominal growth and corporate earnings must remain sufficiently strong. Rising productivity and incomes could allow households, businesses and governments to absorb the additional interest burden. However, if yields remain elevated as growth slows, debt-service costs will consume more cash flow, reducing spending, investment and hiring. The longer that imbalance persists, the greater the risk that higher yields undermine the economic expansion and earnings growth needed to support current market valuations.
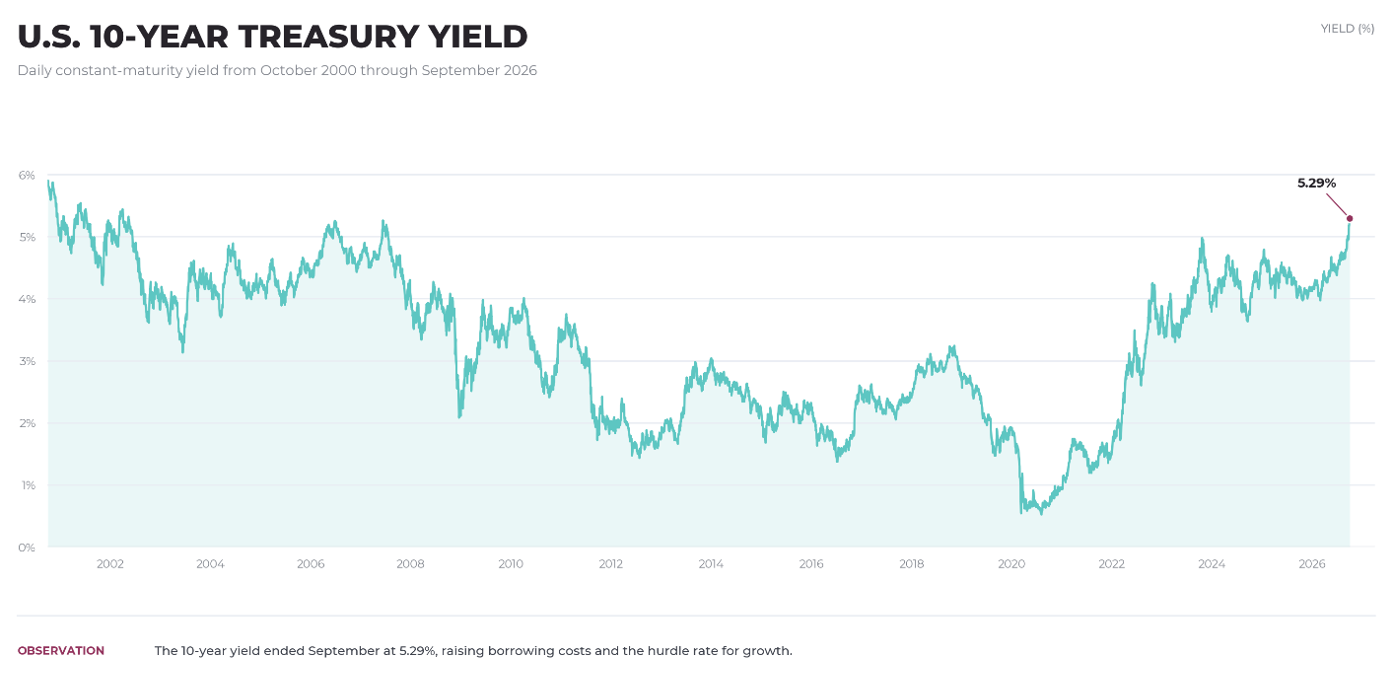
Source: Federal Reserve Board via FRED (DGS10). Daily observations through September 30, 2026.
The S&P 500 as a Technology Trade
The S&P 500 is increasingly behaving like a technology index. Information technology now represents approximately 40% of the benchmark, up from less than 7% in 1990 and above its dot-com-era peak of roughly 33%, while the ten largest companies account for almost 40% of its total weight. These figures understate the index’s effective technology exposure because AI-linked companies such as Alphabet, Meta and Amazon are classified outside the information technology sector.
This concentration has caused the S&P 500 to move increasingly in line with technology-heavy benchmarks. At the end of September, the S&P 500’s 30-day correlation with the S&P 500 Technology Index stood at 0.95, meaning broad U.S. equity exposure has recently moved almost in lockstep with a single sector. Technology leadership has also masked weakness beneath the surface. During the third quarter, the capitalization-weighted S&P 500 gained approximately 2.3% on a price basis, while the equal-weighted index declined about -1.9%. Since late July, almost all of the index’s gains have come from Microsoft, Meta, Apple, Alphabet and Nvidia. At the same time, fewer than 45% of S&P 500 stocks remain above their 200-day moving averages.
Concentration is not inherently negative: the largest technology companies remain highly profitable and are producing strong earnings growth. However, it reduces the diversification investors may believe they are receiving from broad-market exposure. It also leaves the index increasingly sensitive to AI spending, technology earnings and long-term interest rates. With Treasury yields above 5%, the market will require continued earnings growth to justify elevated valuations and offset the higher discount rate.
Key takeaway: The S&P 500 may contain 500 companies, but its direction is increasingly determined by a small group of technology and AI leaders. This concentration can sustain the rally while earnings remain strong, but it also increases the market’s vulnerability if leadership falters.
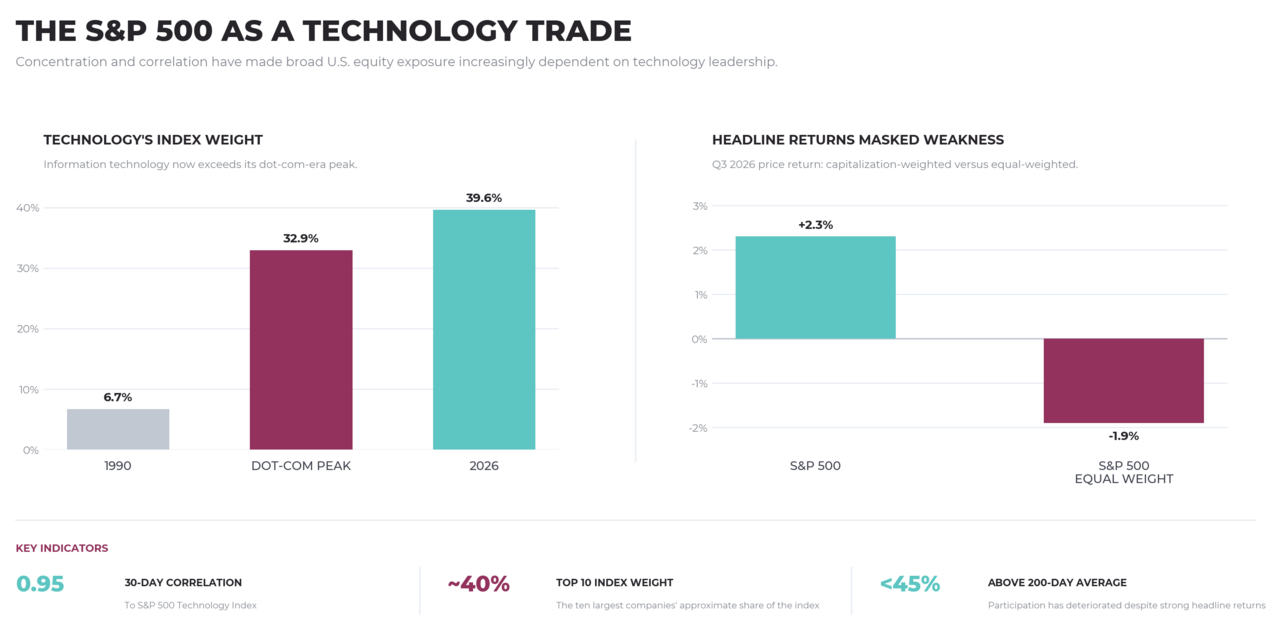
Sources: CME Group, S&P Global, Dow Jones Market Data, LPL Financial and QW Asset Management. Data through September 30, 2026.
U.S. Midterms: Policy Uncertainty Meets Market Fragility
The November midterm elections arrive at a sensitive point for markets. Treasury yields are above 5%, the federal deficit remains elevated, the conflict with Iran is sustaining pressure on energy prices, and equity-market leadership has become increasingly concentrated. Control of Congress could therefore influence fiscal policy, geopolitical strategy and investor confidence during the final two years of the Trump administration.
Prediction markets currently imply roughly a 92% probability that Democrats regain the House and about a 64% probability that they also win the Senate, leaving Senate control as the key swing factor. A change in either chamber would create greater resistance to the administration’s domestic and foreign-policy agenda. This could restrain additional spending or tax measures, but it could also lead to budget confrontations, policy paralysis and uncertainty around the government’s broader economic strategy. Republican control would provide greater policy continuity and executive flexibility, although it could also leave markets exposed to continued fiscal expansion and elevated Treasury issuance.
The election could also complicate the trajectory of the U.S.–Iran conflict. A Democratic-controlled chamber would likely use war-powers votes, funding negotiations and congressional hearings to challenge the administration’s strategy. However, this should not necessarily be interpreted as a clear path toward de-escalation. Congressional opposition could make the conflict more difficult to prosecute without providing the administration with a politically or strategically acceptable way to withdraw. Recent attempts to restrict the president’s war powers have largely followed party lines and have not materially changed U.S. policy.
The United States also has limited room to reduce its involvement without first securing a credible reopening of the Strait of Hormuz. Before the war, the Strait carried roughly one-fifth of global oil and liquefied natural gas shipments, making freedom of navigation central to both U.S. strategic objectives and the global inflation outlook. Current negotiations have connected a ceasefire and changes to the U.S. blockade with a phased reopening of the waterway. Withdrawing while commercial passage remains restricted would risk appearing strategically unsuccessful while leaving the principal source of the energy shock unresolved.
Inflation will remain a market risk regardless of the election result. Higher energy prices, tariffs, persistent deficits and rising debt-service costs are unlikely to disappear with a change in congressional control. The more relevant question is whether the election produces a more credible policy path—or adds another layer of gridlock to an already difficult fiscal and geopolitical environment.
The outcome may also create sector-level winners and losers. Technology, defence, energy, financials and healthcare could face changing expectations around regulation, taxation and government spending. While equities have historically performed well following midterm elections as political uncertainty subsides, that pattern may be less reliable when oil prices, inflation and Treasury yields remain the dominant market forces.
Key takeaway: Neither party offers an immediate solution to the fiscal, inflation or geopolitical risks facing markets. Republican control would provide greater policy continuity, while Democratic gains would add checks on the administration but raise the risk of gridlock. Ultimately, the most important market question is whether Washington can restore normal passage through the Strait of Hormuz, contain the conflict with Iran and establish a more credible fiscal path. Without progress on those fronts, the midterms may add volatility without resolving the pressures already driving Treasury yields and equity valuations.
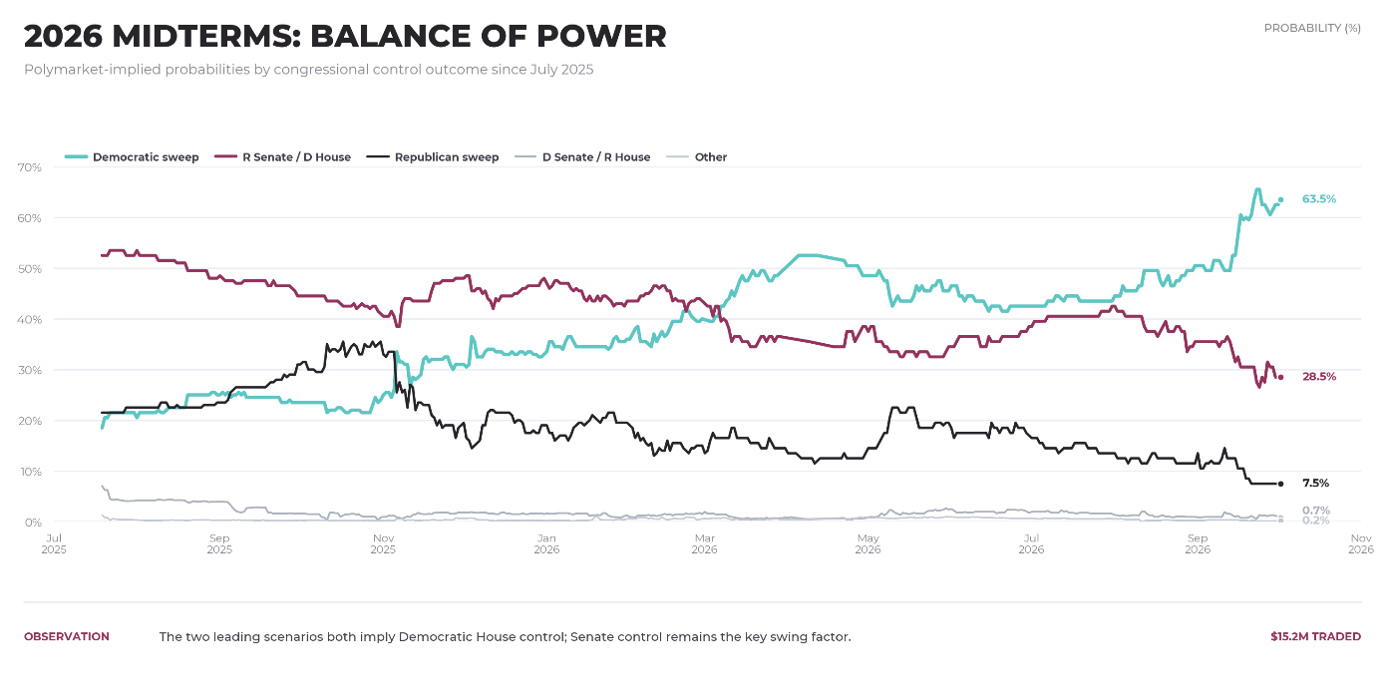
Source: Polymarket. Snapshot retrieved October 1, 2026. Prices are market-implied probabilities and may not sum to 100% because contracts trade independently.
Canada Falling Behind: A Different Kind of Economic Risk
The economic challenges facing Canada and the United States are increasingly divergent. The U.S. continues to generate resilient consumer spending, business investment and employment, but that strength is contributing to persistent inflation, higher Treasury yields and elevated equity valuations. Canada faces a different problem: weaker underlying growth, lower productivity and greater household sensitivity to borrowing costs.
Canada’s second-quarter rebound was stronger than expected, with real GDP increasing 0.8% and real GDP per capita rising 1.0%. However, much of the per-capita improvement reflected a declining population, and one strong quarter does not reverse the longer-term erosion in Canadian living standards. Productivity growth remains below 0.5% annually, while business investment per worker continues to trail the United States.
The U.S. economy, by comparison, expanded at a revised 2.2% annualized rate in the second quarter, supported by consumer spending and substantial investment in AI-related infrastructure. Private domestic demand remained particularly firm, suggesting that underlying momentum is stronger than the headline growth rate implies. The labour-market gap is similarly pronounced: Canada’s unemployment rate stood at 6.4% in August, compared with 4.1% in the United States.
This divergence creates a particularly difficult policy backdrop for Canada. The Bank of Canada’s policy rate remains at 2.25%, but markets are pricing approximately four quarter-point increases over the next 12 months. This would lift the overnight rate to roughly 3.30%, even as growth remains weak and unemployment sits well above U.S. levels. The expected tightening reflects persistent inflation and energy-price pressures rather than domestic economic strength, creating the risk that the Bank is forced to raise borrowing costs into an already interest-sensitive economy.
Canadian households are particularly exposed to this risk. Elevated debt levels, shorter mortgage terms and regular refinancing mean that higher policy and bond yields are transmitted into household cash flow more quickly than in the United States. Four additional rate increases would raise variable-rate borrowing costs immediately and increase the payment burden facing households as mortgages renew, placing further pressure on consumption, housing and employment.
The currency is increasingly reflecting Canada’s relative vulnerability. The Canadian dollar has fallen to approximately US$0.70—near an 18-month low—as investors respond to stronger U.S. growth, higher U.S. yields and uncertainty around Canada’s economic outlook. A weaker currency may support exporters, but it also raises the cost of imported goods and reinforces the inflation pressures preventing the Bank of Canada from supporting the economy.
Key takeaway: The U.S. faces an overheating and valuation problem; Canada faces a growth and household-sensitivity problem. Markets are pricing approximately four Bank of Canada rate increases over the next year—not because Canadian growth is strong, but because persistent inflation may leave the Bank with little choice. Raising rates into a softer labour market and a highly indebted household sector would deepen Canada’s economic vulnerability and increase the risk of a stagflationary outcome.
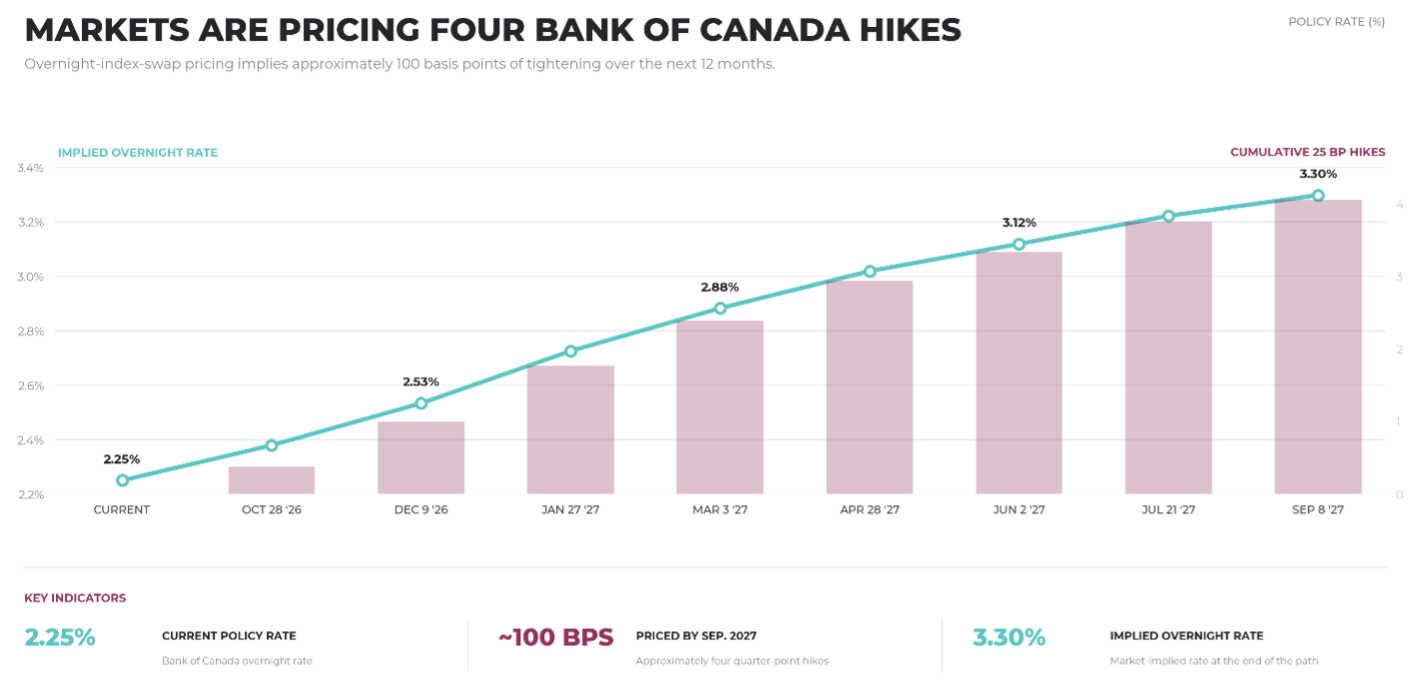
Source: Bloomberg WIRP, Canada OIS model. Pricing date: October 1, 2026. Market-implied pricing is not a forecast and may change materially.
Conclusion
Markets enter the fourth quarter with positive equity momentum, resilient economic activity and continued optimism around AI-driven investment. However, market breadth has deteriorated sharply, with fewer companies participating in the advance. This increasing reliance on a narrow group of technology leaders leaves equity markets more vulnerable to disappointment.
Persistent inflation may also keep pressure on fixed income, particularly if investors continue to demand greater compensation for fiscal risk, rising debt issuance and uncertainty around the future path of prices. Even after the strong returns of recent years, equities remain one of the more effective long-term defences against inflation, alongside commodities and other real assets. As the purchasing power of money declines, companies with pricing power can generate higher nominal revenues and earnings, allowing equity values to adjust over time.
We remain cautiously optimistic. Economic growth and corporate earnings remain supportive, and stronger productivity could help markets absorb higher borrowing costs. However, elevated yields will gradually create friction across households, businesses and governments, while political gridlock may make it more difficult to implement credible fiscal or geopolitical solutions. The opportunity remains, but future returns are likely to require greater selectivity, diversification and discipline than investors have needed in recent years.