The inverted yield curve has long been one of the most reliable indicators of an impending recession. Historically, a downturn follows between 6 and 18 months after the curve first inverts.
In simple terms, an inversion occurs when long-term bond yields fall below short-term yields, suggesting that investors expect future interest rates—and by extension, future growth—to decline. When the economy slows, central banks typically respond by cutting rates or expanding their balance sheets through quantitative easing to stimulate activity. The yield curve, therefore, can be interpreted as the term structure of expected yields, showing how markets anticipate policy will evolve over time.
That cycle held true through nearly every modern slowdown—until 2022.
When the Playbook Broke
The 2022 inversion was different. For the first time in forty years, the economy was running too hot, not too cold. Inflation surged, driven by supply-chain disruptions, shifts in inventory management, fiscal stimulus, and years of easy money. Central banks had to respond in reverse—tightening policy instead of easing it.
As the U.S. Federal Reserve raised rates, short-term yields spiked above long-term ones, producing an inversion of the yield curve. But this time, the message was potentially inverted too. The curve wasn’t warning of collapsing demand—it was reflecting the market’s assumption that inflation would eventually be brought under control, and that monetary policy would normalize once price stability was restored.
In other words, the yield curve inverted not because the economy was weakening, but because it was overheating, and markets expected policy tightening to eventually cool it down.
The Longest Inversion on Record
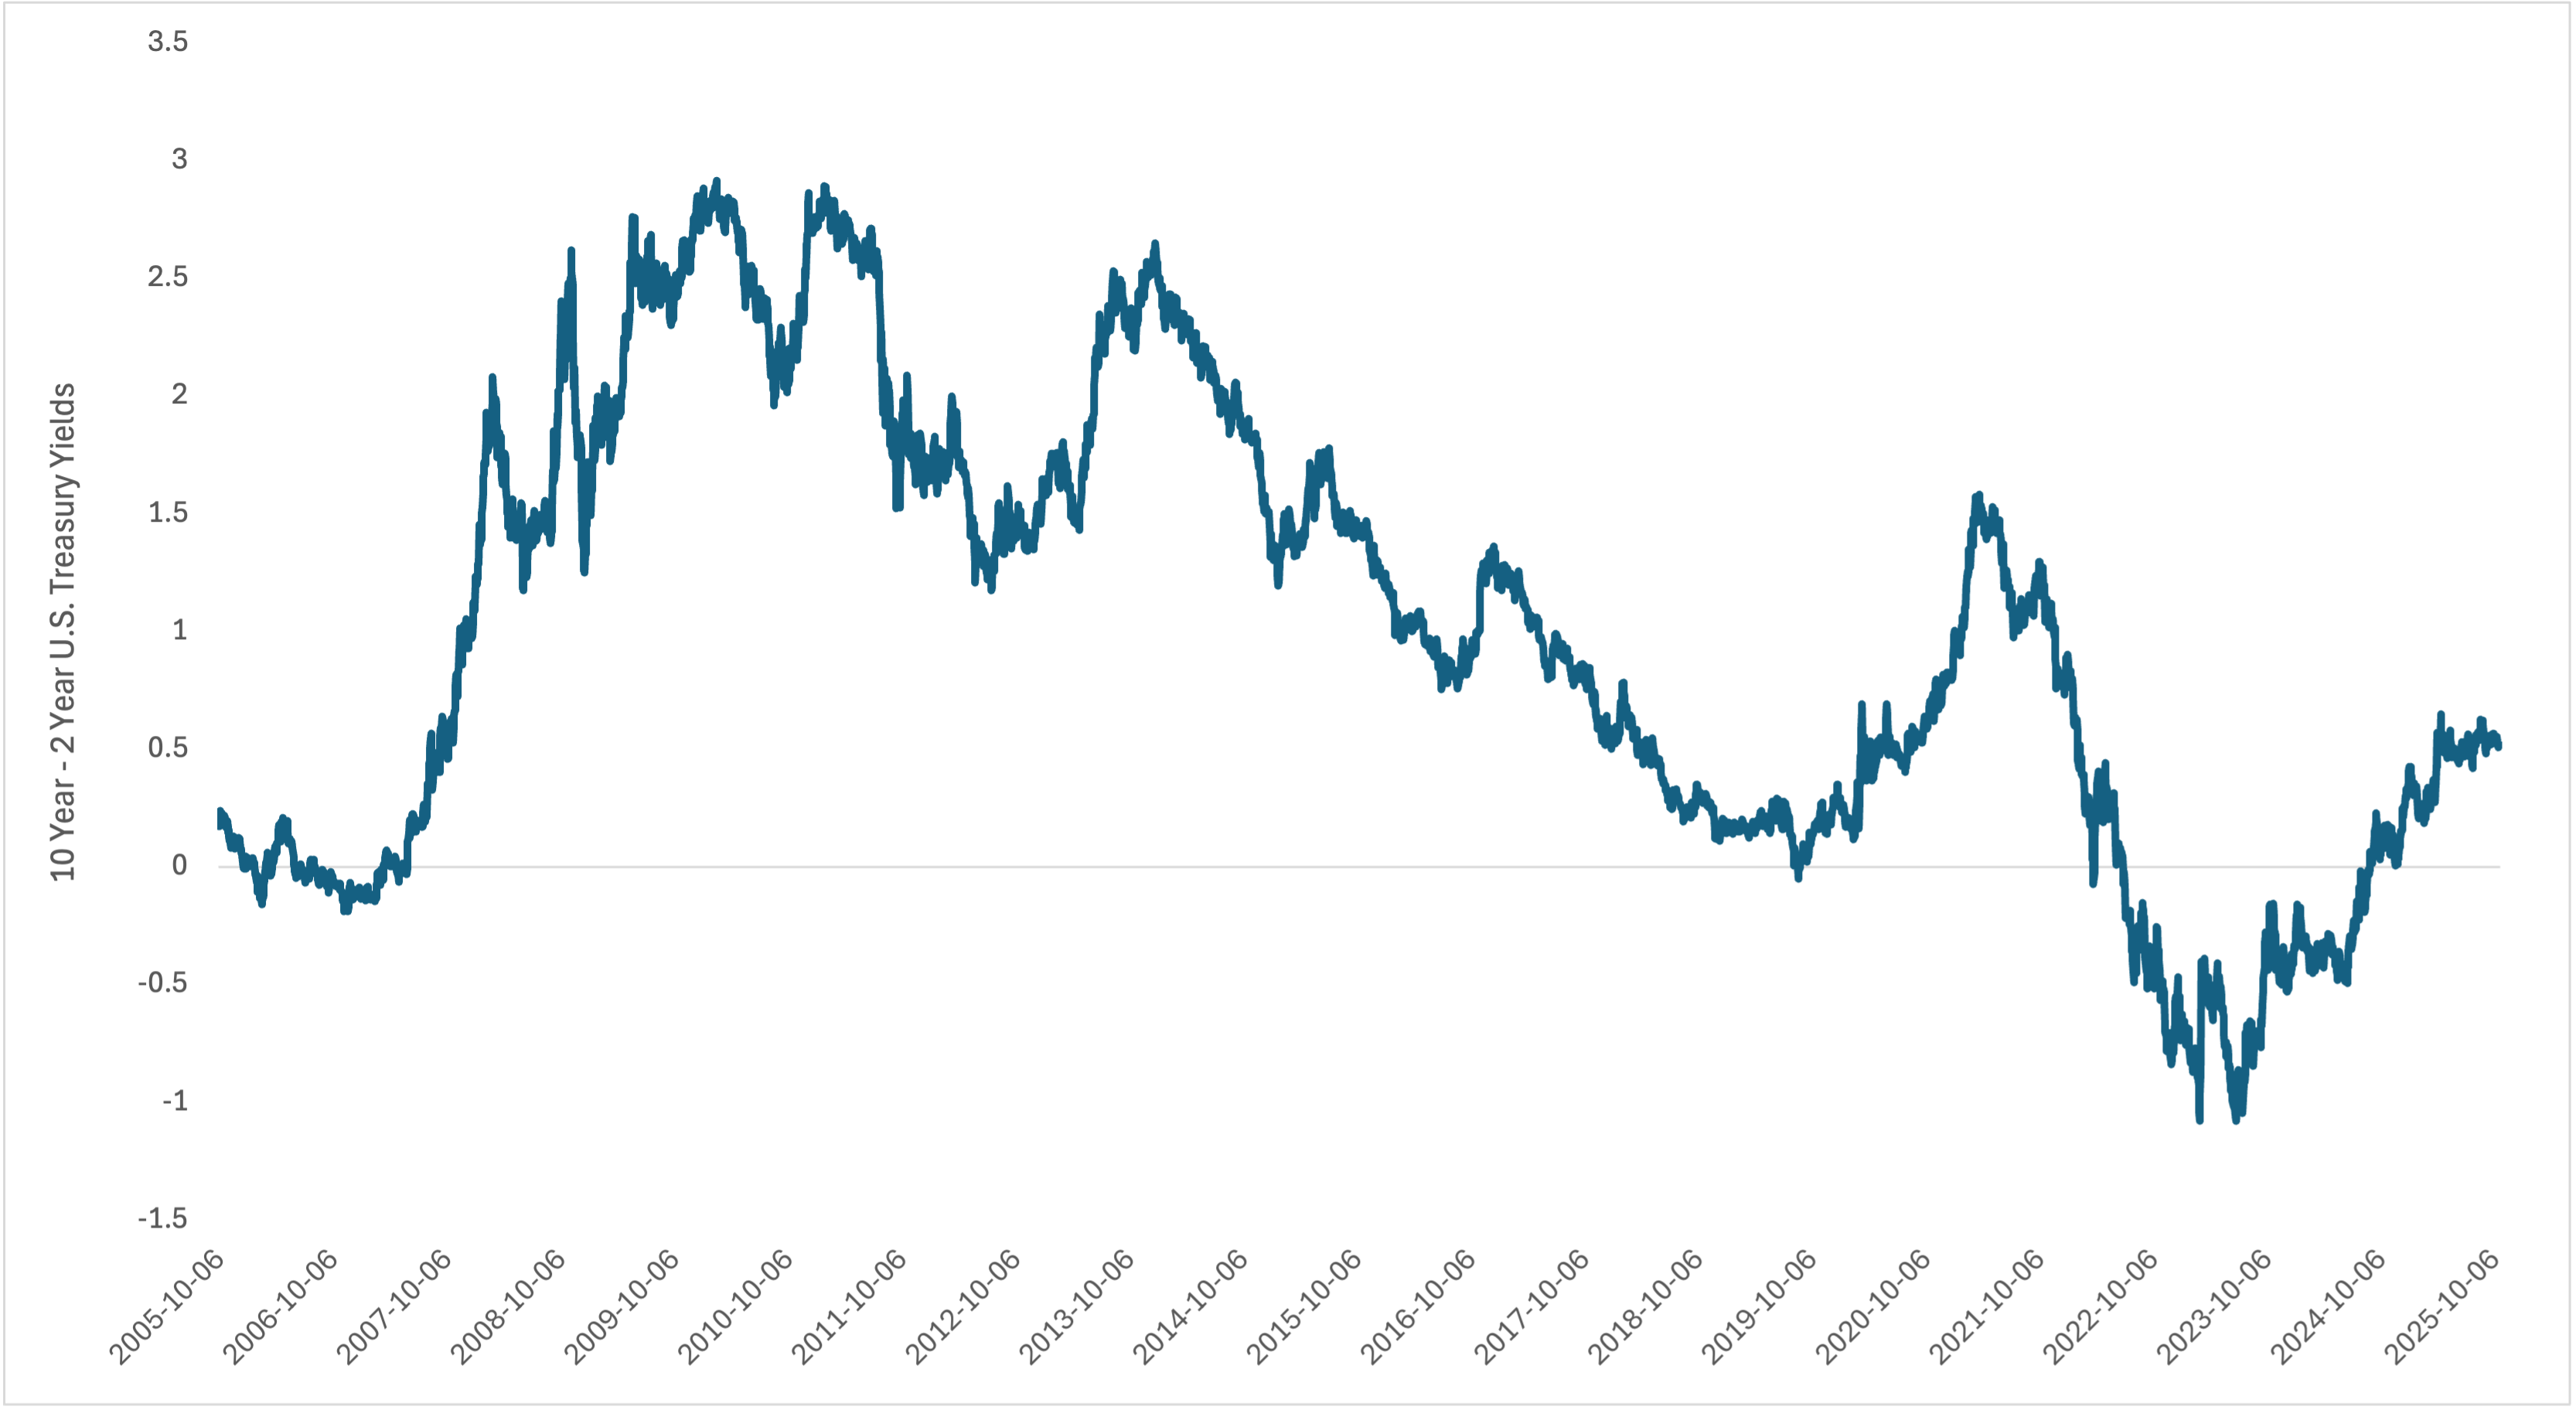
The most recent inversion has also been one of the longest on record spanning 793 days from July 2022 to August 2024. Inflation proved stubborn and persistent, driven more by supply-side issues than traditional demand cycles. The Covid lockdowns coupled “just in time” inventory practices, amplified price pressures and created a structurally tighter supply environment.
It’s now been 13 months since the 10-2s (10-Year – 2-Year Treasuries) normalized, and (however the 10-Year Treasury Yield – the Fed Overnight Rate, reinverted earlier this year) —yet the long-awaited recession hasn’t yet arrived. That’s unusual given the yield curve’s near-perfect historical record. But as noted, this inversion came under unique circumstances—central banks tightening into inflation rather than easing into slowdown. Introducing economic signals that are seemingly out of Bizarro World.
In this cycle, the yield curve didn’t predict a recession. It reflected the market’s belief that inflation would eventually normalize and policy would loosen once stability returned. The signal wasn’t wrong—it may have been just misinterpreted.
10-Year Minus 2-Year U.S. Treasury Yield Differentials
A New Regime: Debt, Inflation, and Debasement
Looking forward, the structural backdrop suggests we’ve entered what can be called a debasement regime—an era defined by chronic fiscal deficits, rising sovereign debt, and recurring inflationary waves.
In such an environment, yield-curve inversions may no longer serve as clear warning signs. Instead, they may reflect periodic inflation shocks or policy distortions, rather than the onset of contraction.
As global debt levels climb and fiscal dominance takes hold, central banks are increasingly constrained.
They can’t raise rates indefinitely without risking systemic strain. Inflation becomes the “release valve” for debt—a subtle form of default through currency debasement.
The curve still inverts, but the message has changed: it may no longer always forecast a recession—it’s now signaling the limits of policy itself. Lower yields on the long end may suggest that tighter monetary conditions are the prescribed solution to inflation. But maintaining those conditions for too long risks breaking the system—as seen during the 2022 regional bank defaults. In that sense, lower long-term yields can also signal the market’s belief that the Fed will eventually fold its cards—backing off its inflation fight to preserve financial stability.
When Policy Distorts the Signal
Beyond debt and deficits, modern monetary tools have further distorted the curve’s meaning. Quantitative easing (QE) and quantitative tightening (QT) give central banks direct influence over long-term rates, allowing them to manipulate yields across the curve. That control mutes natural price discovery, blurring the line between genuine market expectations and balance-sheet engineering.
What was once a clean macro signal has become entangled with policy mechanics. An inversion today might simply reflect the byproducts of bond-purchase programs or liquidity drains, rather than underlying economic fundamentals. And while the Fed is widely expected to wind down its quantitative tightening (QT), it’s clear that these balance-sheet tools are now a permanent part of the central-bank arsenal—ready to be redeployed whenever conditions demand.
And when the next crisis inevitably hits, it’s likely that central banks will go one step further—introducing formal Yield Curve Control (YCC) to cap yields altogether. We’ve already seen glimpses of this in Japan, and the U.K.’s 2022 gilt crisis hinted at how quickly intervention can return. In that world, the yield curve won’t just be distorted—it’ll be scripted.
The End of Bizarro Economics — or Just the Beginning?
In the old world, an inverted yield curve signaled trouble ahead. In today’s world, it may simply reflect the architecture of intervention—where fiscal dominance, balance-sheet policy, and inflation volatility redefine the market’s signals.
What once forecasted recession may now indicate something else entirely: that the market believes inflation will be reined in, policy will remain reactive, and the cycle will persist—no matter how inverted the data looks.
So perhaps this isn’t the end of Bizarro Economics after all. Perhaps it’s the new normal—an upside-down economy where the signals still matter, but not for the reasons they used to.
Disclosure:
Quintessence Wealth, a registered Portfolio Manager in Alberta, British Columbia, Manitoba, New Brunswick, Newfoundland and Labrador, Nova Scotia, Ontario, Prince Edward Island, Quebec, and Saskatchewan, an Investment Fund Manager in Newfoundland and Labrador, Ontario, and Quebec, and an Exempt Market Dealer in Alberta, British Columbia, Manitoba, New Brunswick, Newfoundland and Labrador, Nova Scotia, Ontario, Quebec, and Saskatchewan. The Ontario Securities Commission (OSC) is the principal regulator for Quintessence Wealth.
The opinions expressed are based on an analysis and interpretation dating from the date of publication and are subject to change without notice. The information contained herein may not apply to all types of investors. The opinions in this market outlook were prepared by Alfred Lee as of the date of this report and are subject to change without notice. The opinions expressed in this report are that of the author and do not necessarily reflect the opinion of Q Wealth as a firm. This report is not to be construed as an offer or solicitation to recommend Q Wealth products to clients.